
As you may recall, last month R/V Sally Ride was easily visible from La Jolla and Scripps Institution of Oceanography. The science mission was to recover moorings (strings of instruments anchored to the seafloor) that were deployed in the La Jolla Canyon area a few months earlier. Belonging to the lab of Scripps professor Dr. Matthew Alford, these moorings collect data for the study of internal waves. Such waves are found everywhere in the ocean and are similar to waves on the ocean surface in that they form on stratified boundaries. Surface waves form where dense water meets lighter air, whereas internal waves form at the boundary between warmer, fresher water at the surface and colder, saltier, denser water below. And, just like surface waves break onto the beach, internal waves can break underwater when the seafloor acts as an obstacle. On the continental shelf, and especially in places like submarine canyons, they tend to break quickly and really mix things up. In the La Jolla Canyon, this mixing brings colder nutrient-rich water from offshore into La Jolla Cove, which supports the rich ecosystem in and around the marine protected area.
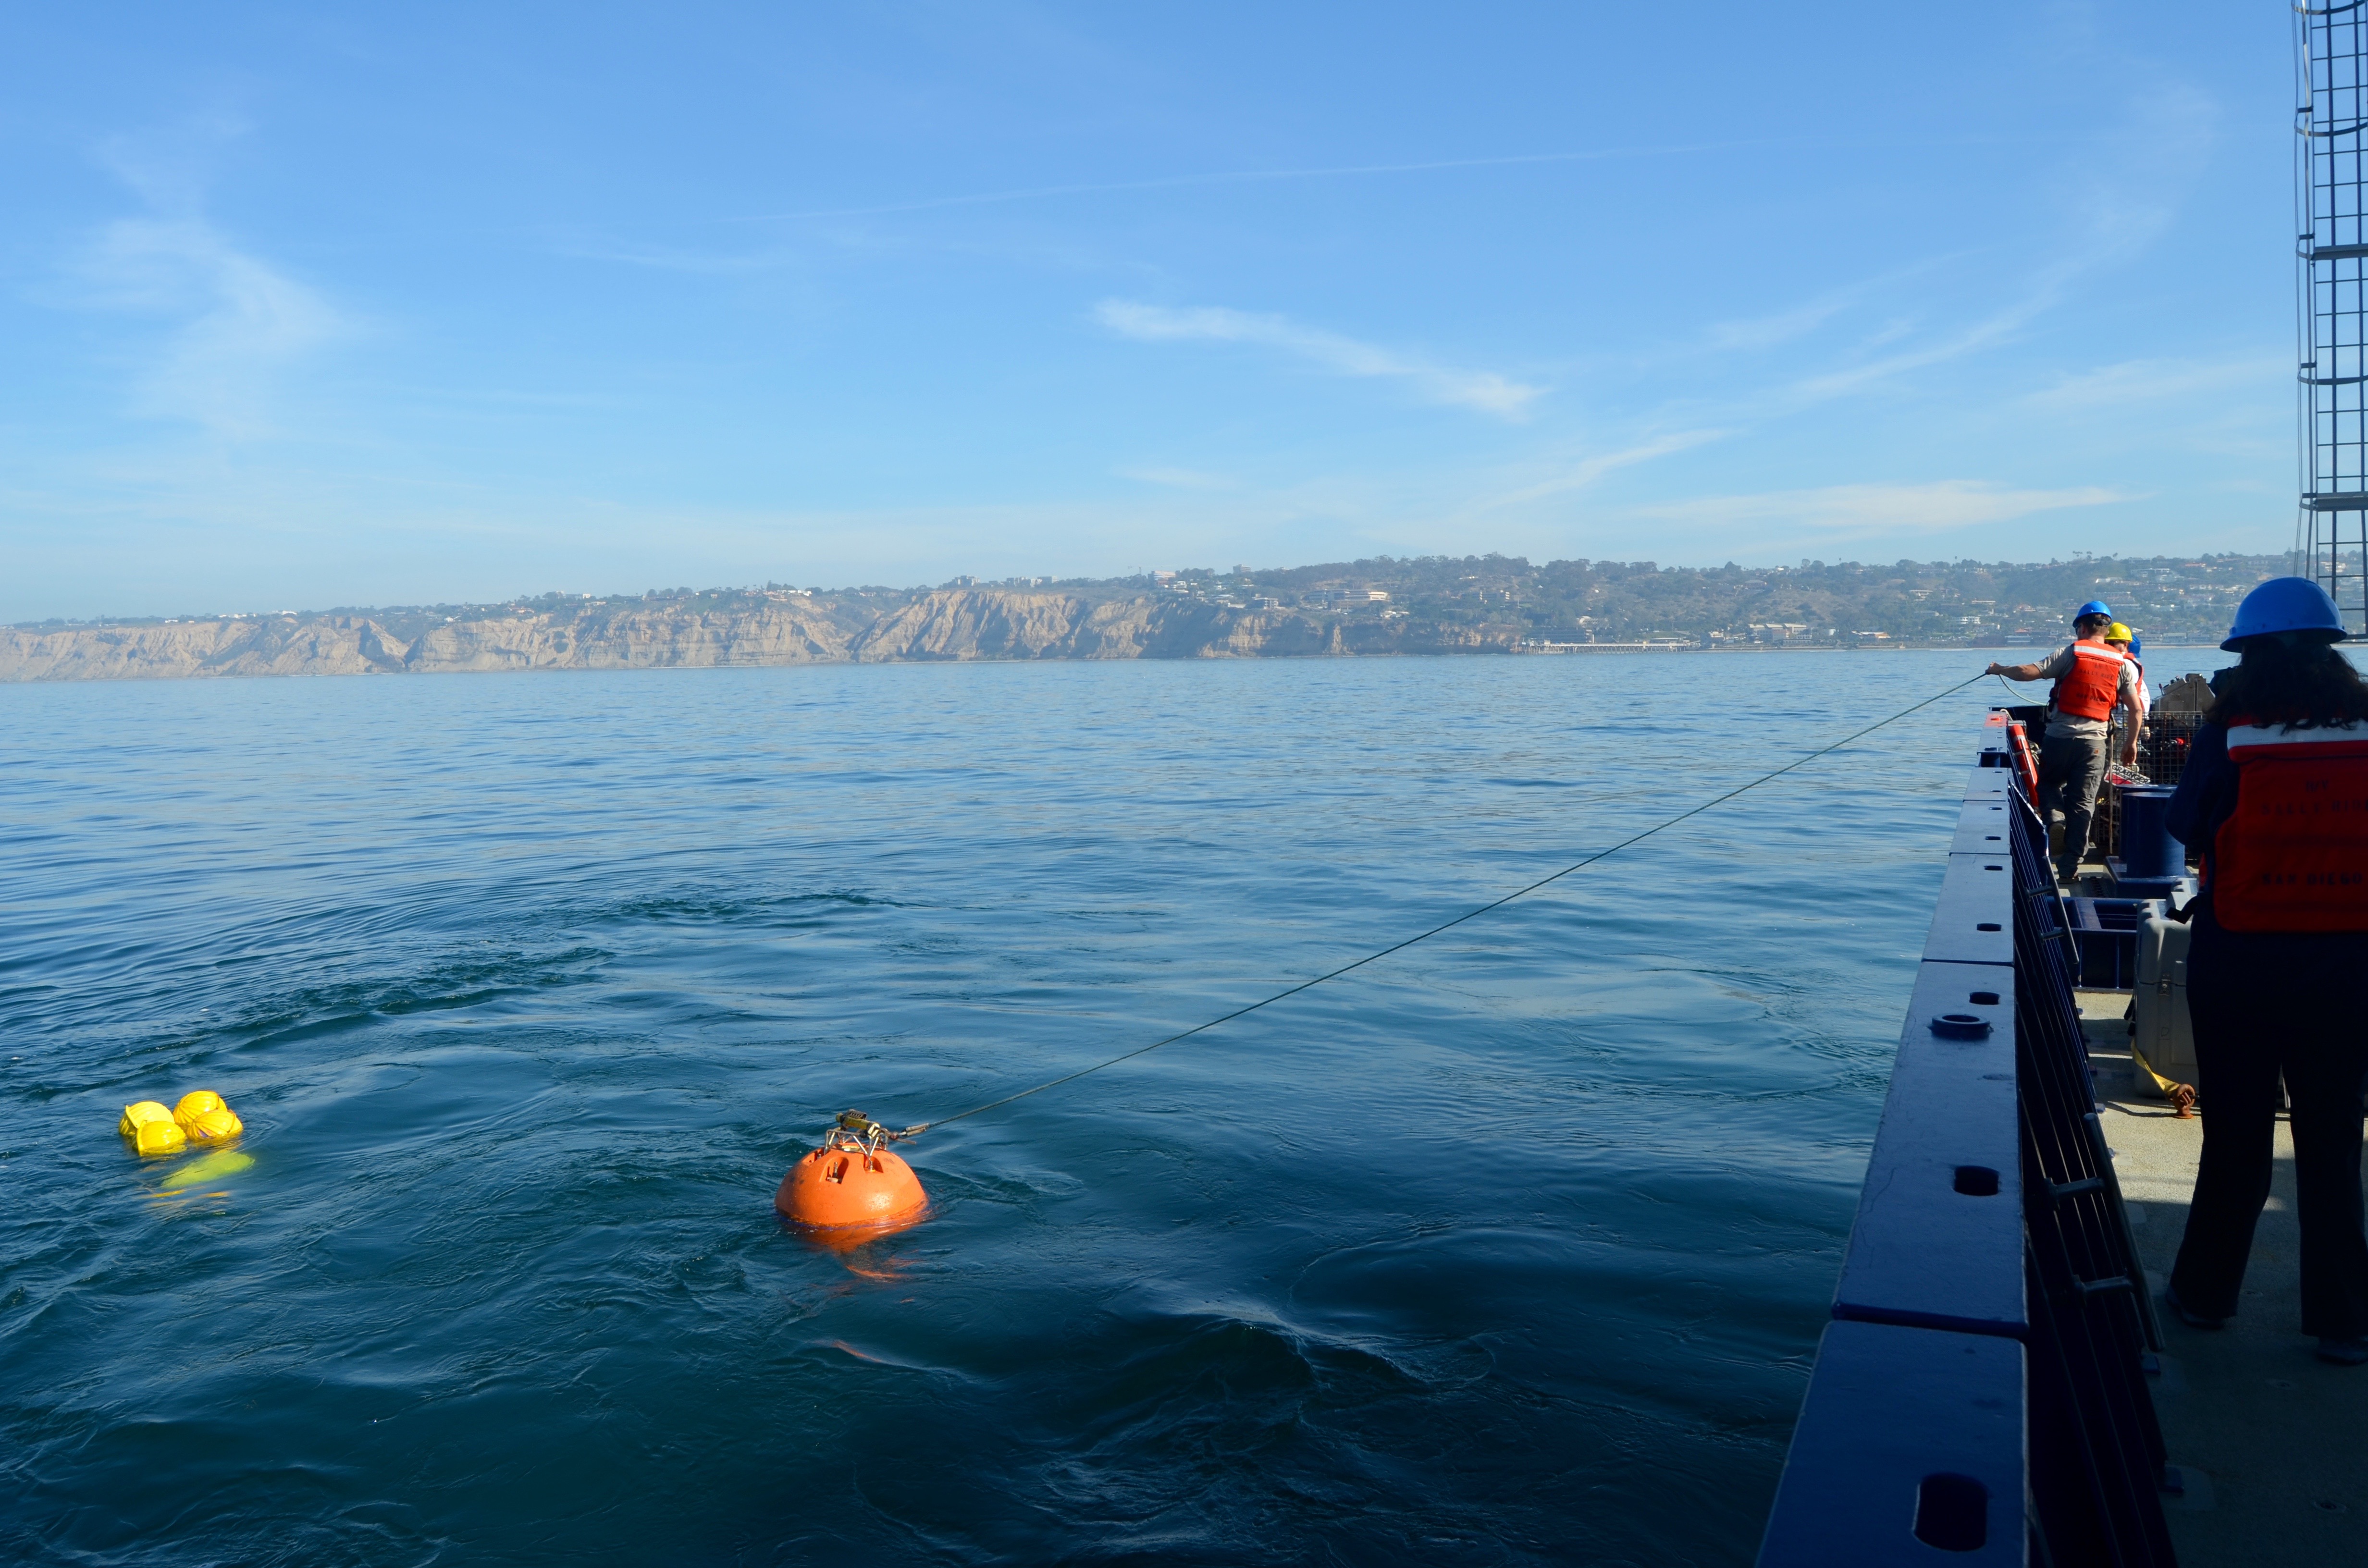
La Jolla and the SIO campus and pier make an inspiring backdrop as a float from the instrument string
is maneuvered alongside R/V Sally Ride for recovery via the A-frame on the back deck.
The instruments on the moorings help graduate students like Maddie Hamann, who served as chief scientist for this cruise, understand that process. Each string has an ADCP (Acoustic Doppler Current Profiler) to measure ocean currents, CTD (Conductivity, Temperature, and Depth) sensors to measure the density, and turbulence sensors to detect mixing. The ADCPs and CTDs had been recording data every 30 seconds for months, and storing it on their local hard drives. So the first step once everything was brought aboard the ship was to connect computers to those drives and hope for the best. Two moorings were recovered, all with their data intact.
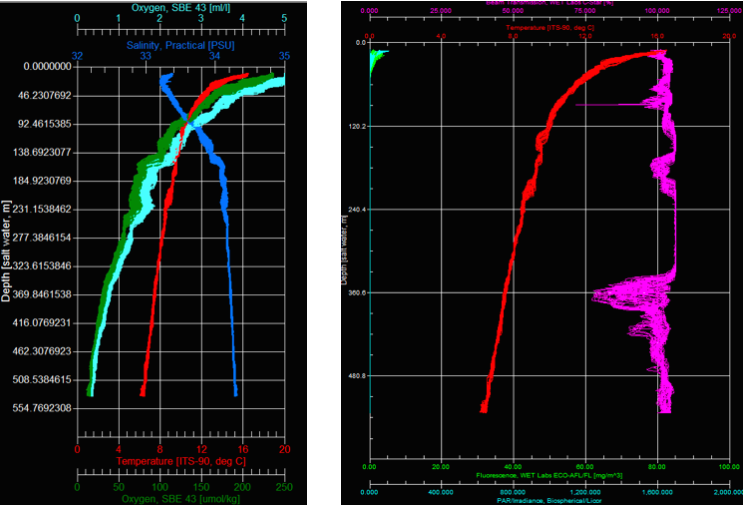
The CTD software readout from night 1, which overlays 33 roundtrips worth of data
from 4 sensors onto each plot.
Mooring recoveries are easiest and safest during daylight hours. But ship time is never wasted – over the two nights spent aboard R/V Sally Ride, the CTD rosette was put into service, though in a different way than on previous science verification cruises. Instead of a sound speed profile or collection of samples, it was sent on yo-yos, where the whole package is lowered to within a few meters of the seafloor, then brought up to within a few meters of the surface. The cycle was repeated for at least 12.5 hours each night, or the equivalent of one tidal cycle. No niskin bottles were attached to the rosette, as no water samples were taken. The first night we were in 540 meters of water and the CTD made 33 round trips; the second night was 210 meters and 53 round trips. In all my years in oceanography, I’d never seen the CTD used this way. The crew members in charge of running the winch controlling the paying in and out of wire worked in two hour shifts all night to support the operation.
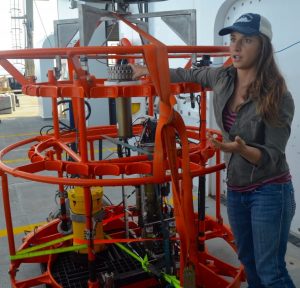
Chief scientist Maddie Hamann shows off the CTD rosette package. Note the lack of sampling bottles. The LADCP is the yellow cylinder attached to the lower inner frame.
The usual sensors were attached, along with some extras, including a fluorometer (measures chlorophyll-a, giving an estimation of phytoplankton abundance), transmissometer (measures particles using the strength of a beam of light), altimeter (sends pings to report the distance from a solid object, in this case to avoid hitting the seafloor), and an ADCP. Technically now an LADCP (Lowered ADCP), the data from this will be combined with data from the ADCPs on the moorings, as well as those mounted to the bottom of the ship. Maddie will spend months converting this data into turbidity models, which go into a NASA database that tracks currents and changes in ocean temperature. Models populated with satellite data are reliable only on the scale of kilometers; this data helps program those models to be accurate to within meters.
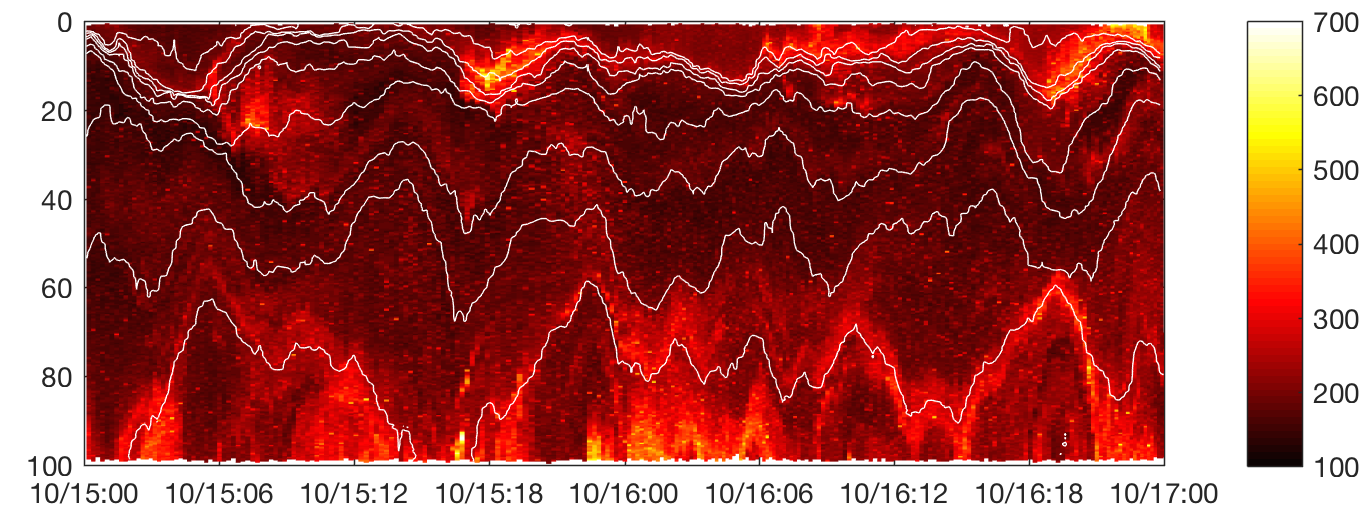
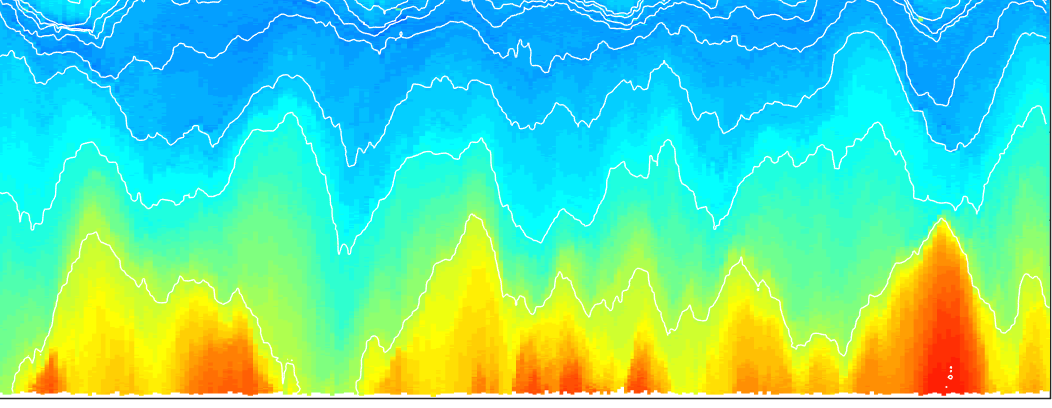
This visualization of backscatter plot data from a mooring transmissometer shows how internal waves shift layers of water. The x-axis is date and time (in 24h), y-axis is water depth in meters; white contour lines are temperature. Units are counts, how many times the beam of light was interrupted, indicating the presence of zooplankton. The high abundance (yellow) near the surface are likely feedings events, and correspond to low levels of chlorophyll-a (what they feed on). High abundance near the seafloor is likely sediment being churned up by internal waves.
For more info on this project, check out the following videos.