
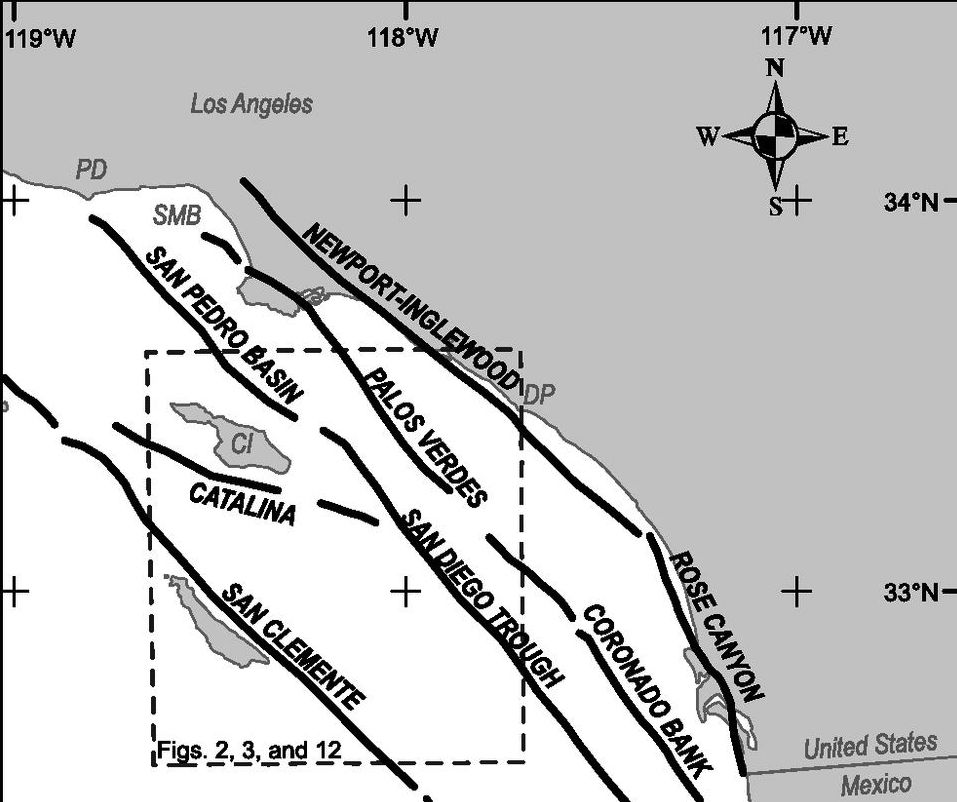
A map of offshore faults in the Southern California Bight.
Figure from the Bulletin of the Seismological Society of America.
For three nights on this research cruise aboard R/V Sally Ride, John DeSanto, a graduate student in Dr. David Sandwell’s lab at Scripps, used the ship’s multibeam to map the seafloor. His target was an area of the San Diego Trough fault, which runs offshore from the Mexican border to Catalina Island. The multibeam, as you may remember from a previous post, sends out acoustic pings and uses the response time and angle to create a detailed map of the seafloor. John provided waypoints to the bridge, used by the mate on watch to drive the ship at a speed of 5 knots in transects over the area around the fault.

John at his station in the main lab.
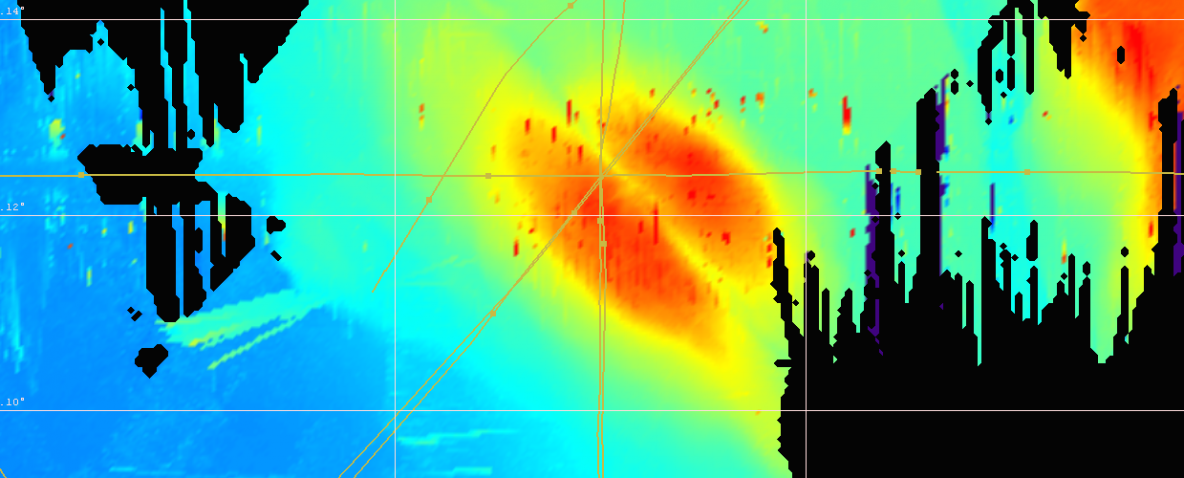
The below picture is a screenshot from one of the multibeam systems, which John and the computer tech Daniel monitored during the survey each night. The first night had some rough weather, which can lead to rough data. The software is integrated with a motion reference unit onboard to compensate for the pitch and roll of the ship. And though the hull of Sally Ride was specifically designed to minimize bubbles forming around the transducers mounted to it, the latest storm, with 20 knot winds and waves up to 12 feet, still left gaps in the data. Night two was much calmer, and the ship began the transects after recovering the ROV. This time, just as we approached the crosshairs of the grid, of where the fault line is most prominent, a slow-moving tanker moved into our path. Lining up for the Santa Barbara Channel, one of the busiest shipping lanes on the planet, it had the right of way. So R/V Sally Ride deviated from its path, crossing west of the intended area (red arrow below). The final night of the survey, however, was uninterrupted, and provided great detail of the fault as it slashes through a seamount.
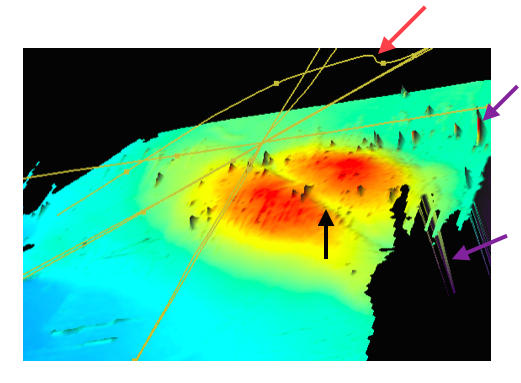
Multibeam data overlapped from the three nights of surveys. The red area is a seamount bisected by the fault (black arrow). Ship track lines are in yellow, including the diversion made to avoid ship traffic (red arrow). Artifacts of “bad” data (purple arrows) can be removed in processing. Depth scale is 650 meters (in red) to 1100 meters (in blue) below sea level.
Multi-beam data from SIO ships, and others in the academic fleet, are part of the public domain. Google Earth incorporates these detailed maps into their database. Try zooming in on certain sections of the ocean, and you’ll see swaths where the data is noticeably better than others. Those are cruise tracks where multibeam data was recorded, which provides resolution on the scale of ~100 meters while the rest of the ocean has been mapped using satellite altimetry (also a result of the Sandwell lab at Scripps), which has more like 500 meter resolution. It’s a fun exercise for those of us who work at sea to zoom in on detailed tracks we know we were part of. SIO Games put together a ship track visualization so you can see where Scripps ships have explored over the past 60+ years, check it out here and try matching it up with the detailed areas on Google Earth. R/V Sally Ride runs her multibeam systems almost all the time, so we’re adding to the dataset even when it’s not the main science focus onboard. Something on the order of 10% of the world’s oceans have been mapped in this fine detail, so there’s a lot left to cover.
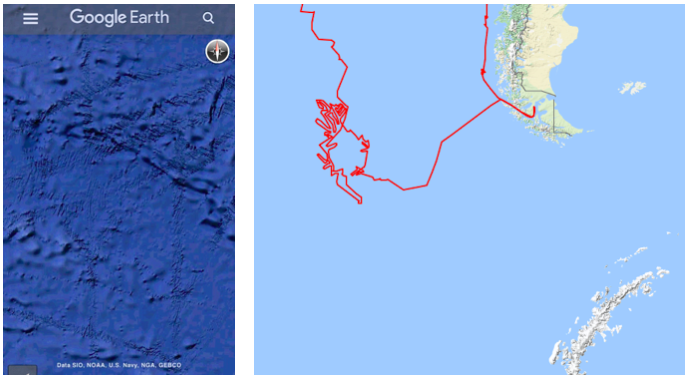
This Google Earth screenshot, with areas of higher resolution populated in part by SIO data, matches up to a research cruise (right) on the R/V Roger Revelle in the Southern Pacific Ocean. Ship track by SIO Games site http://siogames.ucsd.edu/Ship_Tracks/