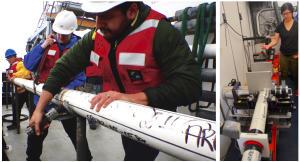
Gus, Amy, and Liane cut the core sample into smaller sections (left), which are then processed by Emily (right) in the MST (multi-sensor track) van.
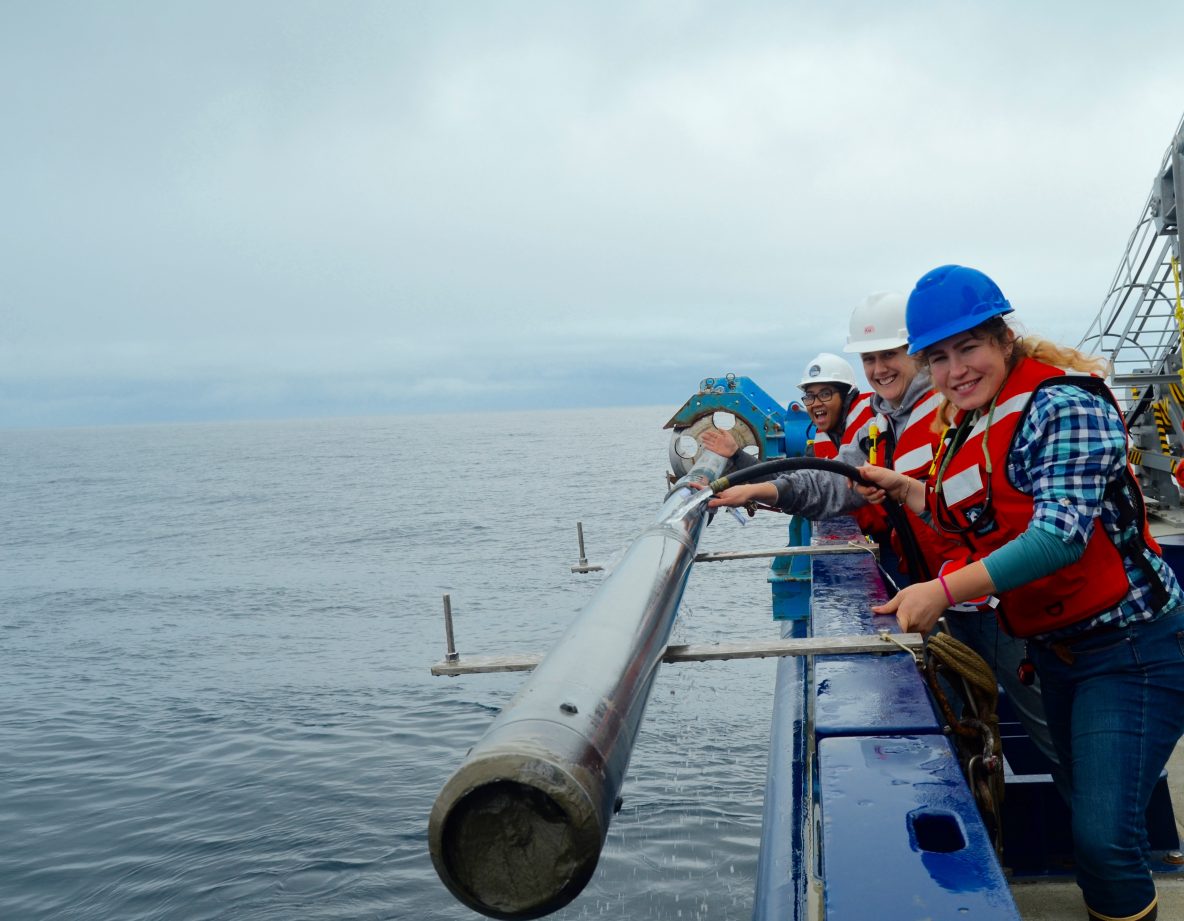
The core samples taken so far onboard R/V Sally Ride have utilized either a 20 or 30 foot long cylinder with PVC pipe inside. Ideally, the entirety of the pipe is filled, but the amount of sediment actually recovered can vary. For example, if a layer underneath the surface of the seafloor is harder clay, the pipe may get stopped short. Once back onboard, the samples are stored in the PVC pipe, and cut into smaller sections in order to be processed by the core logger. Inside a converted container van with a painting of the OSU beaver on it, a non-destructive suite of tests are run with various instrumentation. SIO grad student Emily, from Dr. Neal Driscoll’s lab, oversees the measurements.

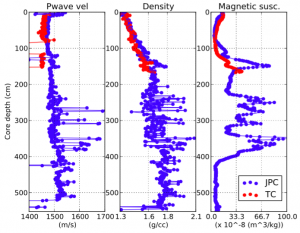
Data plots generated by the core logger. The piston core (blue) and trigger core (red) were taken on the same deployment.
P-wave velocity data is used to determine grain size, gamma density measures water content and porosity, and magnetic susceptibility helps to match up different samples taken in the same area. This includes traces from the deeper piston core (labelled JPC in the chart), mid-level trigger core (TC), and surface multi-cores (not yet part of the data set).
In this example, the magnetic susceptibility trace (far right) can be used to determine that the piston core (blue trace) slightly overshot its target, sinking below the surface. The zig-zag at around 120 centimeters matches one in the trigger core (red) at closer to 150cm.

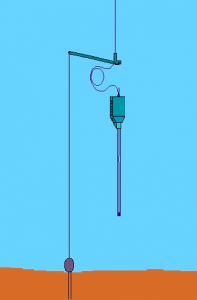
The trigger core (left) is rigged to hit the
seafloor first, releasing the piston core (right).
Photo from OSU CEOAS.
Having the piston core and trigger core overlap helps determine that the piston core sample likely starts at closer to 20cm than 0cm, and the trace should be shifted down.
Back on shore, the samples will be split amongst the multiple institutions onboard. At SIO and the USGS, they will be cut in half length-wise so that one half can be analyzed while the rest is archived for future use. Until then, they are stored in a walk-in climate-controlled room just off the main lab. We’re collecting as many cores as possible during the week, while also learning the procedures that optimize time and sample quality – all part of the plan on this science verification cruise.

